Step 3: Identification of crosses to be made among selected individuals
Now that your list(s) of selected individuals is/are established, it is necessary to identify the crosses to be made to initiate the next MARS cycle. We addressed crosses between individuals of a single list (diallel design) or two complementary lists (factorial design). The diallel situation can be managed with three options: (i) the automatic definition of the whole list of possible crosses according to a half-diallel (complete method, see Fig. 23, 24, 25 and 26), (ii) the "better-half" strategy (Bernardo et al., 2006) which consists of avoiding crosses between selected individuals with the lowest scores (see Fig. 23, 24, 25 and 26) and (iii) application of constraints on the contribution of parents or on the maximum number of crosses (see Fig. 27 and 28). In this last case, best crosses are determined according to either the (weighted) molecular score or the utility criterion. Selfing of selected individuals can be included or not. Then, lists of crosses created via the different methods can be analyzed and compared via graphs.
Example of instructions to create the two lists of crosses that will contain results of the half-diallel and the better-half processes among the previously selected candidates:
Rename the two empty lists of crosses (by double-click) in List6_Half_Diallel_from_QCS and List7_Better_Half_from_QCS. Then, select the appropriate method via the “Option...” button (see Fig. 23 & 24).
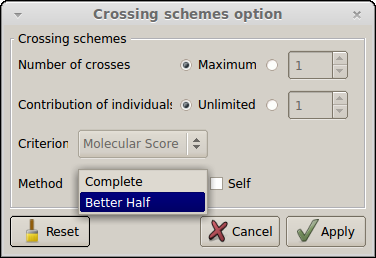
Figure 23: crossing schemes options (method selection)
Choose the list of selected candidates coming from the step 2 (e.g. List4_Complementation_Selection) and the adequate list of crosses (e.g. List6_Half_Diallel_from_QCS & List7_Better_Half_from_QCS). Finally, click on the Run button to see the results of these crosses stored to the appropriate list (see below).
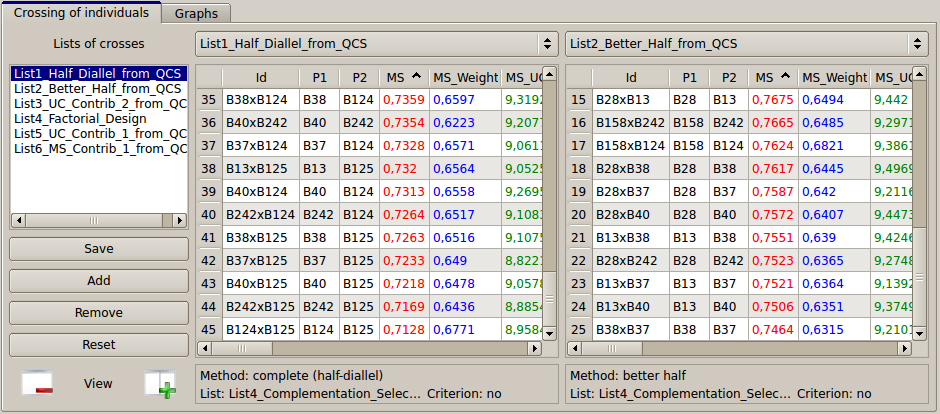
Figure 24: comparison of the two lists (half-diallel vs. better-half) of couples generated
On the left table (see List6_Half_diallel_From_QCS), all the individuals were crossed together. For each of the 45 resulting pairs, a virtual individual is created and OptiMAS computes the expected molecular score of the progeny of the cross for all and each QTL. On the right table, the better-half strategy leads to 25 couples (see also Fig. 25). QTL columns can still be sorted, in order for instance to identify pairs having a score of 0. Note that crosses can be deleted from a list (right click on the selected pair and press the “delete...” button). They also can be copied from one list to the other by "drag and drop".
Meanwhile, graphs are automatically generated to display a view of the selected crosses based on the different strategies (see below).
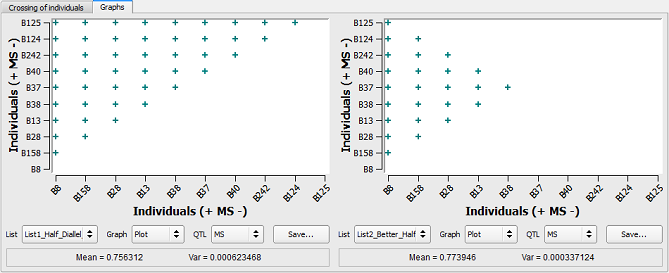
Figure 25: half-diallel vs. better-half strategies
In the figure above, individuals are ranked on the two axes based on their genetic value (MS from highest to lowest). On the left side, the “Complete” procedure (half-diallel) has been applied. All the individuals were crossed together with no limitation on their contribution whereas on the right side (better-half method), crosses between individuals having lowest MS have been avoided (i.e. B37 to B125).
Lists of crosses created via the different methods and/or constraints can also be analyzed and compared via histograms (i.e. select Graph = Histo, see below).
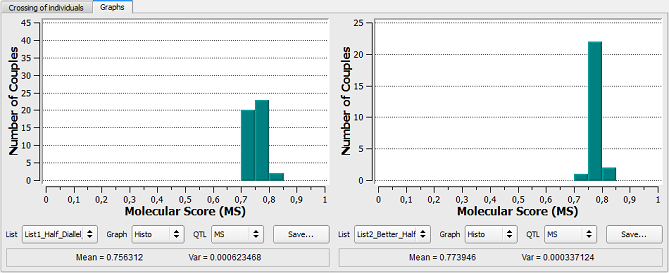
Figure 26: comparison of the two lists (half-diallel Vs better-half) of couples generated
As expected from the higher relative contribution of individual B8, the average MS is higher for Better Half option (0,756312 vs. 0,773946) and the variance of MS among generated couples is lower (6,23 10-4 vs. 3,37 10-4).
Constraints on the contribution of parents or on the maximum number of crosses to be done can be applied (see Fig. 27, 28). In this case crosses determination is optimized based on the expected molecular score and UC of the crosses. This will be exemplified with two new lists of crosses. Press two times the "Add" button to create two new lists of crosses and rename them List4_MS_Contrib_1 and List5_UC_Contrib_1. Then Press the "Option..." button to open the "Crossing schemes option" window (see below).
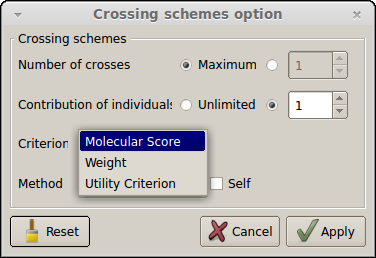
Figure 27: crossing schemes options (constraints)
To specify that each of the ten candidates must be crossed only once and that there is no constraint on the maximum number of crosses to be done, select Contribution of individuals = 1 and leave Number of crosses = Maximum. The criterion box (disable by default) will appear as in Fig. 27. Select Criterion = Molecular Score for the first list and press the “Apply” button.
To apply this strategy to candidates previously selected via the QCS method, select List selection(s) = List4_Complementation_Selection. Then, select the list where crosses will be stored by selecting List crosses = List4_MS_Contrib_1. Press the “Run” button to create this first list.
To apply the same constraints based the utility criterion of the pairs (see Fig. 28 on the right), do the same thing with Criterion = Utility Criterion and List(s) selection = List5_UC_Contrib_1.
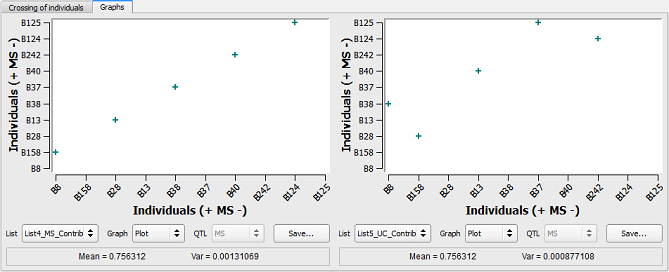
Figure 28: constraints on the contribution of parents based on the MS or the Utility Criterion
On the left side, individuals with the higher MS are crossed together (e.g. B8xB158, B28xB13, etc) whereas on the right side, the use of the utility criterion resulted in different pairs (e.g. B8xB38).
A factorial design between two lists of selected plants can be applied. Checking the box between the two lists enables the possibility to select a second list of selected candidates (see below).
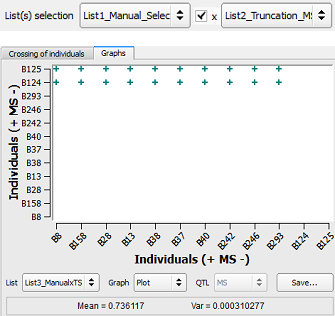
Figure 29: factorial design applied between two lists of selection
Thus, a list containing only two individuals (B124 and B125) previously found via the QCS method has been crossed with the ten individuals having the highest MS (i.e. List1_TS_MS) resulting in a factorial design displayed in Fig. 29.